
completed assessments
Cleaning operations readiness report
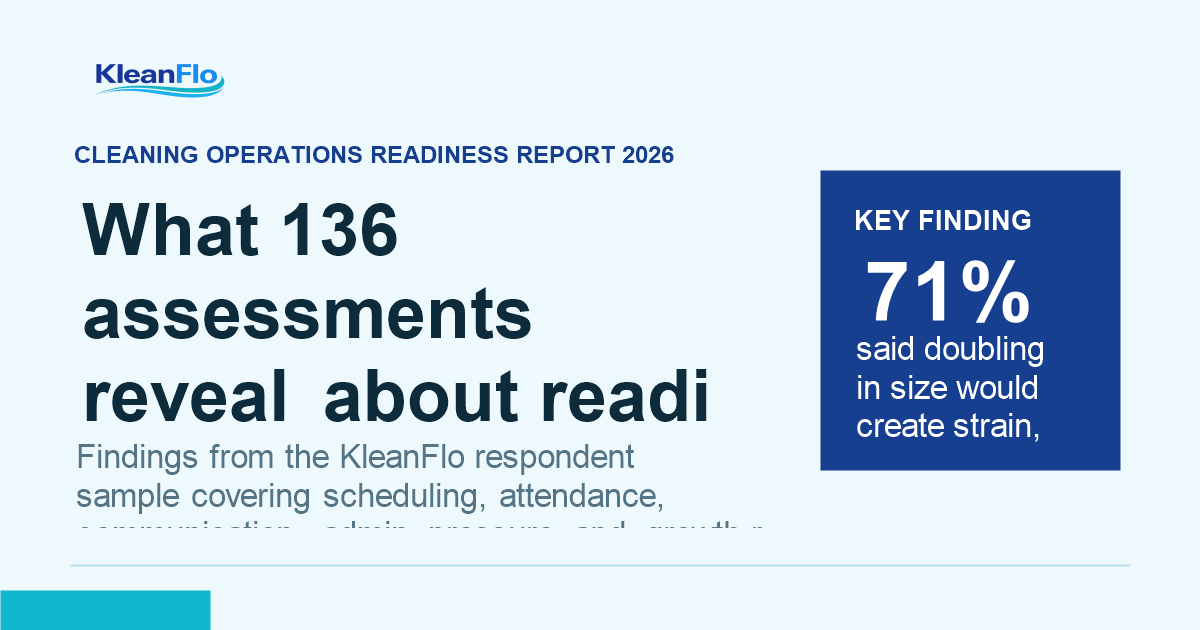
Cleaning Operations Readiness Report 2026: what 136 assessments reveal about readiness to scale
Based on 136 completed KleanFlo readiness assessments, this report looks at where respondents felt strongest, where day-to-day pressure still appeared, and which operational gaps could become more risky as the business grows.
SchedulingAttendanceClient communicationGrowth readiness
Source: anonymised KleanFlo readiness assessments completed between 23 April 2026 and 9 August 2026. Percentages are calculated from 136 completed assessments and should be read as findings from the KleanFlo respondent sample, not a national industry census.
Average respondent readiness score
66.5%
Many respondents appeared operationally capable day to day, but the answers suggest growth could expose weak links in scheduling, cover, proof of service, communication and repeatable processes.
average growth readiness score
say cover is stressful, a scramble or reliant on calls
do not have a formal lone worker safety process
Headline finding
71% said doubling in size would create strain, chaos or require major system change
Only 40 of the 136 completed respondents said their systems were already built to scale. The remaining 96 said they would struggle, become chaotic or need to change a lot if the business doubled tomorrow.
Industry context
Why operational readiness matters
The BCC's 2026 research, using the latest available figures, reports nearly £72bn of economic contribution and a workforce of 1.51 million. In a sector of that scale, repeatable scheduling, attendance evidence, safety processes and quality records become more than back-office tasks.
HSE lone-working guidance is also relevant because cleaners can work alone, especially early morning, evening or remote shifts. Employers are expected to manage lone-working risks through assessment, training, supervision, monitoring, keeping in touch and responding to incidents.
Readiness by area
Finance is ahead. Growth readiness is the pressure point.
The strongest average score was financial control. The weakest was growth readiness. Respondents reported stronger financial control than in the other measured areas, but may still need stronger operational systems before adding more contracts, staff, branches or supervisors.
75.3% Financial control
68.3% Client management
65.1% People and attendance
64.3% Operations and scheduling
59.7% Growth readiness
Score distribution
60% scored between 40% and 79%, which is where growth risk often hides
The survey does not show a market split between perfect operators and failing operators. The largest group sits between 40% and 59%, meaning many companies have some control in place but still rely on manual work, informal follow-up or disconnected systems.
Overall readiness bands
Under 40% 11
40-59% 51
60-79% 31
80%+ 43
Average category scores
Response breakdowns
The operational detail behind the headline scores
These charts show the response mix behind the main findings. They are useful because they reveal where confidence is genuine, where teams are coping through effort, and where growth would add pressure.
How schedules are managed
Paper, WhatsApp or spreadsheets 55
Everything in one place 53
Basic system, changes still hard 15
Digital but disconnected 13
How absence cover is handled
Cover confirmed in minutes 48
Usually sorted, but stressful 37
Scramble every time 33
Process relies on calls 18
How attendance is recorded
Digital and payroll-linked 36
Call or text 36
Separate app or system 34
Paper timesheets 30
Lone worker safety process
No formal process 57
Automated alerts 37
Expected to tell someone 23
Manual and inconsistent 19
Client communication style
Proactive visibility 50
Reactive when wrong 43
Phone/email, no set process 37
Occasional reports 6
If the business doubled tomorrow
Would really struggle 41
Systems built to scale 40
Need to change a lot 32
Would manage, but chaotic 23
Headline findings
Where the operational gaps appear
The clearest pattern is not that respondents are failing. It is that many are still relying on methods that can become fragile when contracts, staff numbers and customer expectations increase.
More raw results
Two important findings deserved more of the underlying data
The quality proof and finance sections are shown below with their original question wording, so readers can see exactly what the headline percentages are based on.
Evidence of service quality for a new client
Question: If a new client asked to see evidence of your service quality before signing, what could you show them?
Full audit trail immediately 44
Could assemble it, but it takes time 37
Some reports, not professional enough 29
Not much evidence available 26
Invoice speed after month end
Question: How quickly do invoices go out after the end of each month?
Generated automatically within 24 hours 67
Within a few days, after checks 36
Within a week, with manual work 17
A week or more 16
Invoice confidence
Question: How confident are you that your invoices accurately reflect the hours worked and the service delivered?
Very confident, tied to attendance records 64
Generally right, but fragile 37
Mostly accurate, with cross-checking 21
Sometimes errors are found later 14
Contract profitability visibility
Question: Do you know, right now, which of your contracts is most and least profitable?
Profitability visible at a glance 61
Rough idea, not in detail 32
Sense of it, not formally tracked 26
Reviewed periodically, not real time 17
The biggest message
Many respondents are operationally capable, but too much control still depends on people remembering, chasing and checking.
That creates pressure for owners, operations managers and supervisors. It also makes growth harder because every extra contract adds more schedules, absence risks, site notes, client expectations, attendance records and follow-up actions.
What cleaning companies can take from the findings
- Centralise schedules and rota changes.
- Use GPS, NFC or landline options to strengthen proof of attendance.
- Make absence and cover visible before service is missed.
- Create a formal lone worker process.
- Schedule audits and keep evidence attached to the site.
- Move client communication from reactive updates to visible service records.
- Turn repeatable tasks into workflows with owners and approvals.
Admin pressure
Weekly management time is still being absorbed by admin
Question: How much time do you or your managers spend on admin each week? Admin time is not only a cost. It is time taken away from staff support, customer contact, quality checks and sales follow-up.
Improved, but still room
Constantly eating into time
Systems handle most of it
Manageable but could improve
About this research
Methodology and limitations
- The findings are based on 136 completed KleanFlo readiness assessments submitted between 23 April 2026 and 9 August 2026.
- A total of 305 assessments were started. Incomplete assessments were excluded from the percentages and charts shown in this report.
- Providing an email address was not required for an assessment to be treated as complete.
- The assessment was self-selecting, so the results should be treated as findings from the KleanFlo respondent sample rather than a representative census of the UK cleaning industry.
- Business size, respondent role, location and cleaning sector mix were not used as weighting factors in this report.
- Response options were assigned readiness values and averaged within each category; the overall score is the equally weighted average of the five category scores.
- The five reported categories are Operations and scheduling, People and attendance, Client management, Financial control, and Growth readiness.
Press and reuse
Using these findings
Journalists, trade bodies and industry commentators may quote short findings from this page with attribution to KleanFlo's Cleaning Operations Readiness Report 2026 and, for online publication, a link to this report.
Because this is respondent-sample research, findings should not be described as a national census or as representative of every cleaning company.
About KleanFlo
How KleanFlo helps address the pressure points highlighted in the report
The research findings above are editorial. The links below explain how KleanFlo helps cleaning companies manage the same areas in day-to-day operations.
Management hub
See how the findings fit into a wider commercial cleaning management process.
Commercial cleaning management guideScheduling
Move away from fragile rota changes and give managers one clear view of planned work, cover and site commitments.
Scheduling softwareAttendance
Use GPS, NFC tags or known landline check-ins to create clearer attendance evidence and payroll-ready records.
Time and attendanceQuality
Schedule audits, capture photos and notes, share evidence and use results to support retention and tenders.
Audit softwareClients
Keep customer communication, portal visibility and service evidence inside the same system as the work.
Customer portalProcesses
Create repeatable workflows for onboarding, failed audits, incidents, return to work and customer follow-up.
Process automationMobile teams
Give cleaners and supervisors the tools they need while they are working on customer sites.
Staff mobile appWant to benchmark your own cleaning operation?
Use the KleanFlo business health check to assess scheduling, attendance, client communication, finance and growth readiness.