
Cleaning business reporting
Why metrics matter in a cleaning company
Cleaning companies run on small operational details. A missed shift, an uncovered absence, a late quote, a falling audit score or a customer complaint can all affect service quality, margin and customer confidence.
The problem is that those details are often spread across different places. Sales information may sit in quotations, attendance in timesheets, audit results in quality reports, customer conversations in messages and staff availability somewhere else entirely.
Good metrics bring that information into view. They help owners and managers see what is happening early enough to do something about it.
A dashboard should not be decoration. It should help the business decide where to act next.
The difference between data and useful insight
Most cleaning businesses already have data. They have schedules, quotes, sites, staff records, audit scores, timesheets and customer records. The harder part is turning that data into something useful.
A useful KPI answers a practical question. Are quotes being won? Are surveys being completed? Which customers need attention? Are audits improving or declining? Where is cover becoming a problem? Which supervisors have work building up?
That is why flexible dashboards matter. The owner of the business may want a sales and margin view. An operations manager may want attendance, absence and cover. A quality manager may want audits, actions and customer feedback. A supervisor may only need the sites and issues they are responsible for.
Important KPIs for cleaning companies
The right KPIs depend on the size and shape of the business, but most commercial cleaning companies benefit from tracking a few core areas.
Common reporting problems in cleaning businesses
Reporting often starts with spreadsheets because they are familiar and flexible. That can work for a while, but it becomes harder as the business grows.
- Different managers create different versions of the same report.
- KPIs are updated manually and become out of date quickly.
- Sales, operations, payroll and quality are reviewed separately.
- Business owners only see problems after a customer complains.
- Teams spend time preparing reports instead of acting on them.
The aim is not to create more reports. The aim is to make the right information easier to see.
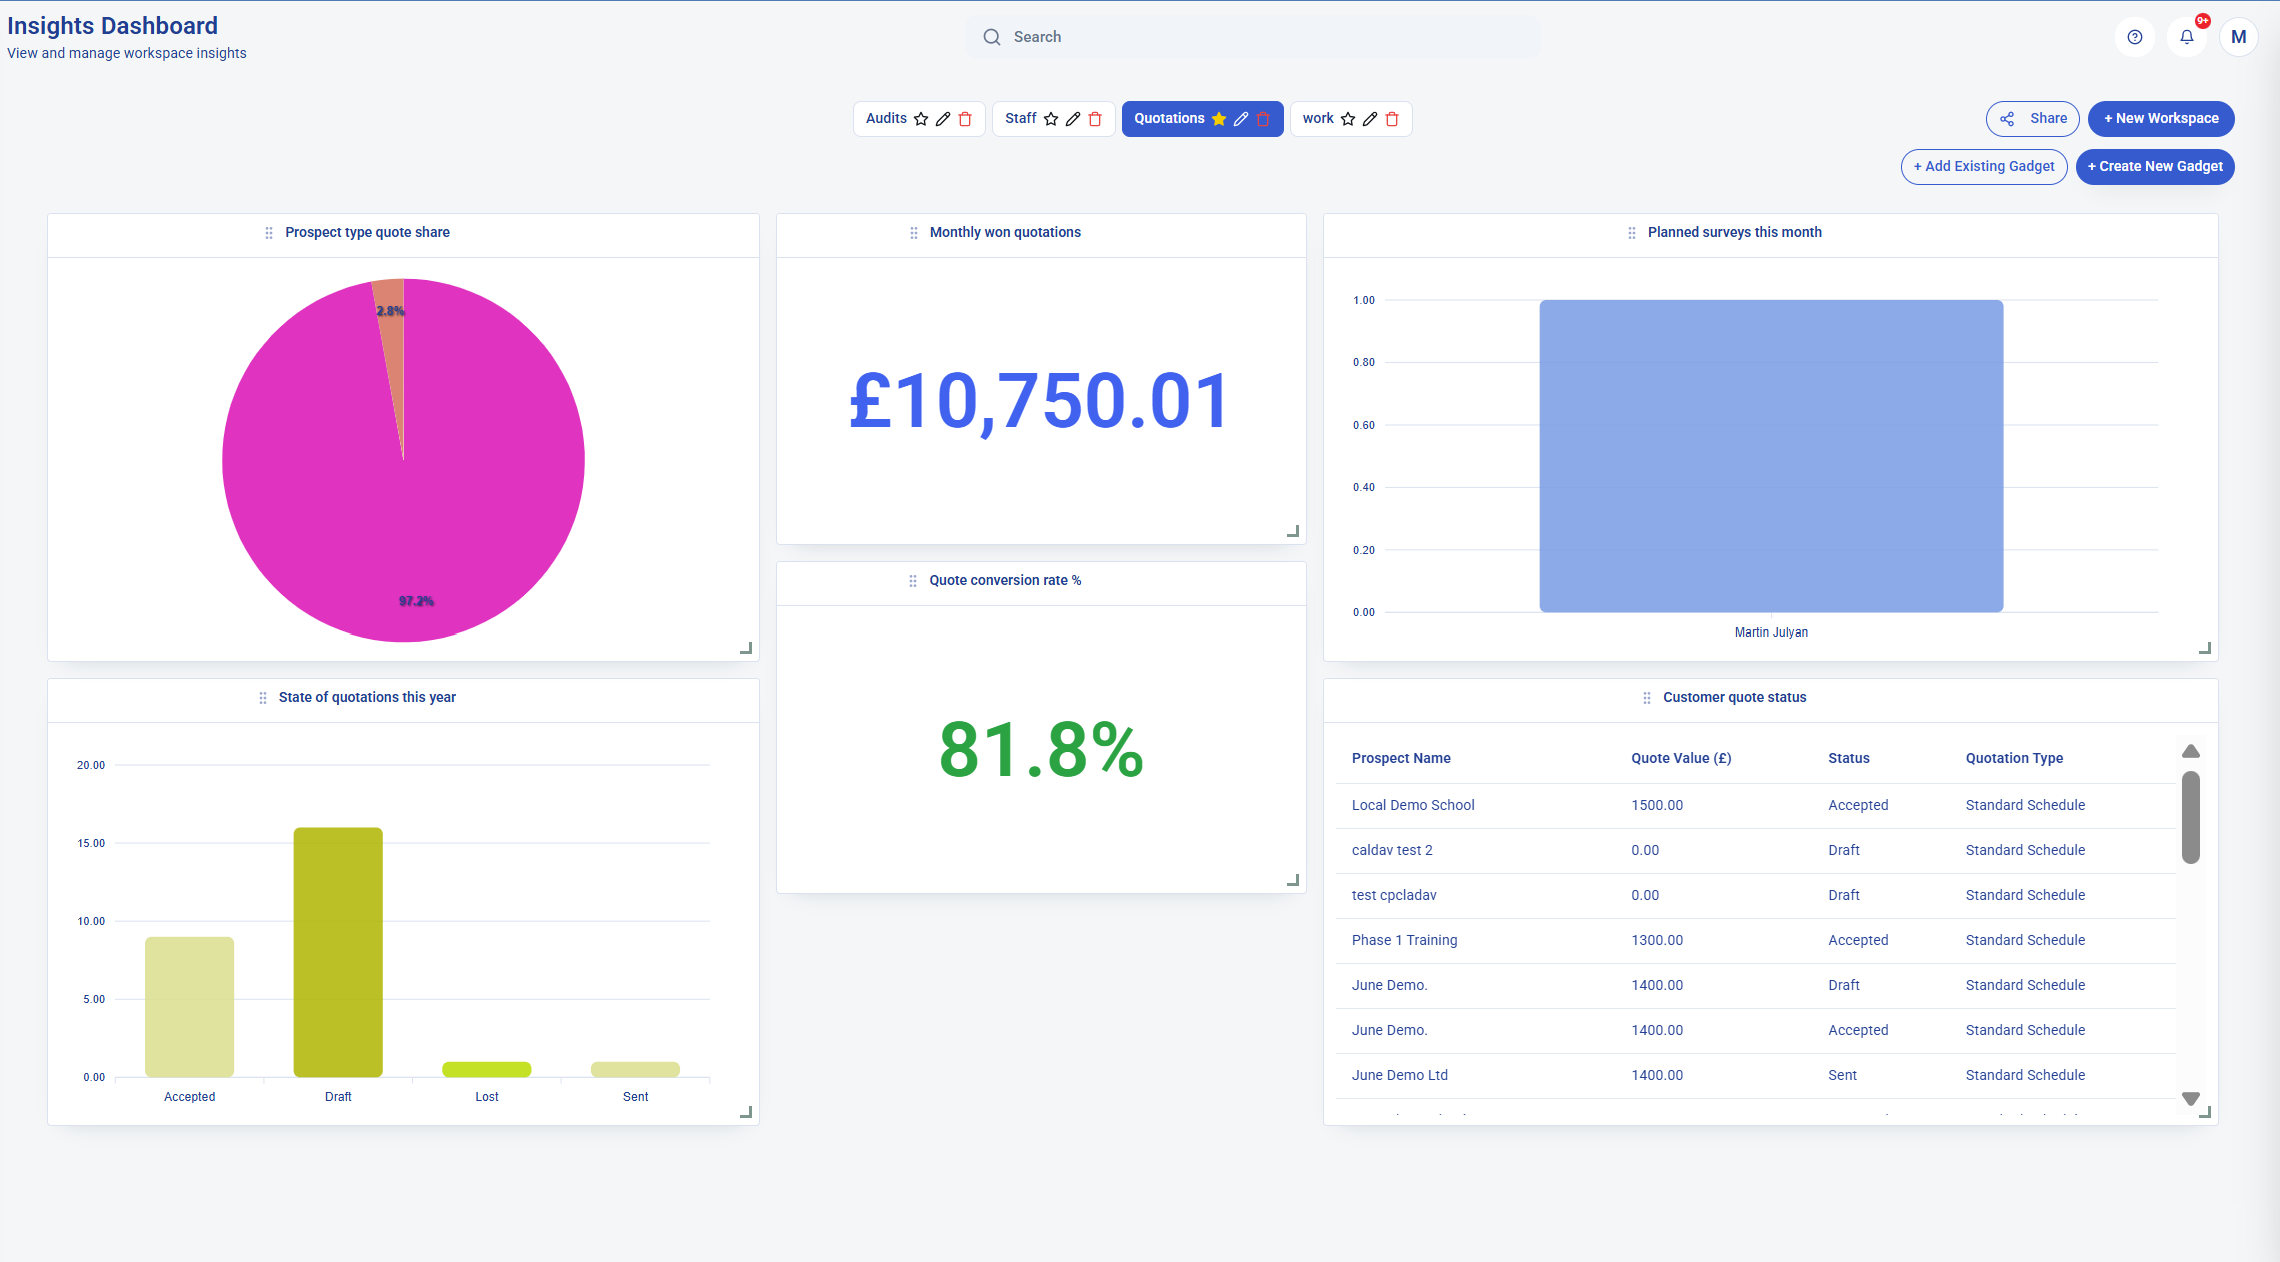 Example workspace: quotation performance, survey activity and quote status in one view.
One view, several questions answered
A workspace can combine charts, headline figures and tables so managers do not have to move between separate reports before deciding what needs attention.
How KleanFlo Insights works
KleanFlo Insights is designed to be flexible. Users can create their own workspaces and add gadgets that show the information they care about.
A workspace might be built around sales, audits, staff, quotations, operations or customer service. Inside that workspace, gadgets can show charts, numbers, tables and performance views. This gives each manager a practical dashboard without forcing every user into the same fixed report.
Create a workspace
Build separate workspaces for sales, audits, staff, operations, customers or management reporting.
Add gadgets
Choose dashboard gadgets that show the metrics, charts or tables needed for that workspace.
Focus the view
Keep each workspace focused on the decisions that person or team needs to make.
Review performance
Use the dashboard to spot trends, bottlenecks and operational issues earlier.
Example: a sales and quotation workspace
A cleaning company owner may want to know how many quotations are being created, how many are being won, what the quote conversion rate looks like and which prospects are still at draft, sent or accepted stage.
That view helps answer practical questions. Is the pipeline healthy? Are quotes moving quickly enough? Are survey visits being planned? Is too much potential work stuck in draft?
Once those numbers are visible, the business can act. It can follow up sent quotes, review lost quotations, book surveys faster or look at whether pricing needs attention.
Example: an operations workspace
An operations manager may care less about quote value and more about service delivery. Their workspace might focus on unassigned shifts, absence cover, supervisor activity, audit actions, timesheets needing review and customer issues.
This matters because cleaning operations are live. If absence cover is not arranged until late afternoon, the site may already be at risk. If timesheets are reviewed weekly instead of daily, payroll problems can build up. If audit actions are not visible, standards can slip quietly.
Best practice for cleaning company dashboards
- Start with the decisions you need to make, not the chart type.
- Keep each workspace focused on one audience or business area.
- Track leading indicators, such as cover required or overdue surveys, not only end results.
- Review KPIs regularly so dashboards stay useful as the business changes.
- Use dashboards to start conversations, not to replace management judgement.
Using dashboards in management reviews
Insights works best when dashboards become part of the normal management rhythm. A weekly review might look at quotation progress, surveys due, cover issues, audit results and customer activity before the team agrees what needs action.
That gives managers the practical picture: KleanFlo is not just storing cleaning data, it is helping the business see what needs attention.