Commercial cleaning performance

Key cleaning business KPIs: a practical guide

Cleaning business KPIs turn everyday operational data into decisions. The right measures show whether contracts are staffed, standards are being achieved, customers are confident and the work remains profitable.

SalesServicePeopleProfit
KleanFlo Insights dashboard showing cleaning business KPIs

Why KPIs matter

See problems before they affect customers and margin

A commercial cleaning company can look busy while performance is quietly weakening. Schedules may be filled, invoices may be raised and customer complaints may remain low, yet paid hours could be drifting above budget, audits may be missed and supervisors may be spending increasing time correcting work. Turnover alone does not reveal those problems.

Key performance indicators create an early-warning system. They convert activity into a small number of measures that managers can compare over time. A good KPI should answer a practical question: Are we delivering the hours sold? Is quality stable? Are problems being resolved? Are quotations becoming contracts? Is each contract contributing the margin expected?

Cleaning work is distributed across many sites and often delivered outside normal office hours. Reliable schedules, attendance records, audits, timesheets, quotations and customer interactions provide the evidence needed to manage by exception.

Useful measurements

What makes a useful cleaning KPI?

A useful KPI is clearly defined, consistently collected and linked to a decision. “Improve attendance” is an intention, not a KPI. “Completed shifts as a percentage of planned shifts” is measurable. Adding a target, such as 98%, makes the expectation clear.

Relevant to a business decision Consistent across sites and periods Available early enough to act Owned by a responsible manager Balanced across leading and final outcomes Supported by reliable operating data

A leading indicator suggests what may happen next. Missed shifts, overdue actions and slow quote turnaround can warn of future complaints, lost sales or contract risk. A lagging indicator confirms what has already happened. Both are needed.

Performance framework

A balanced cleaning KPI framework

Use measures across the business so one strong headline number cannot conceal a service, workforce or profitability problem.

AreaManagement question
SalesAre opportunities moving quickly from enquiry to accepted quotation?
Service deliveryAre planned visits and contracted hours actually being delivered?
QualityAre cleaning standards stable, evidenced and corrected when they fail?
WorkforceIs the team reliable, trained and available without excessive management intervention?
CustomerAre concerns resolved and contracts likely to renew?
CommercialAre labour, materials and rework still aligned with the price?

Essential measurements

13 key KPIs for commercial cleaning businesses

Each KPI should lead to a management question, an owner and a clear response when performance moves outside the expected range.

1

Quotation conversion rate

Quotation conversion shows how effectively qualified opportunities become won work. Calculate accepted quotations divided by decided quotations, excluding those still open. If 24 quotations were accepted and 16 were lost, the conversion rate is 24 / 40 = 60%.

Why it matters: conversion helps assess sales quality, pricing, proposition and follow-up. Review it by sector, salesperson, quotation type and value. A high conversion rate is not automatically good if margins are too low, while a low rate may show poor qualification rather than poor selling. Pair conversion with contract value and expected margin. An Insights sales workspace can keep quotation measures together.

2

Quotation turnaround time

Measure the time from completed survey to quotation sent. For example, five quotes taking 2, 3, 3, 5 and 7 working days have an average turnaround of 4 days. Also track the percentage sent within your service target.

Why it matters: slow responses lose momentum and create extra chasing. A rising turnaround time may indicate incomplete surveys, costing bottlenecks or unclear approval. Review weekly, and separate simple one-off work from complex recurring contracts so the comparison remains fair.

3

Attendance completion rate

Calculate completed shifts divided by planned shifts. If 1,176 of 1,200 planned shifts were completed, attendance completion is 98%. Track missed shifts, late starts and early finishes separately because a headline percentage can hide repeated problems at one site.

Why it matters: attendance is the foundation of delivery. Quality cannot be maintained if planned work is regularly uncovered. Daily exception monitoring lets managers arrange cover before the customer experiences a failure. Compare trends by site, day, branch and work pattern rather than using the figure only as a staff score.

4

Delivered hours against budget

Compare actual approved hours with the hours allowed in the contract or schedule. A contract budgeted for 400 hours but using 420 has a 5% adverse hours variance: (420 - 400) / 400. The cause might be authorised additional work, cover overlap, poor scheduling, rework or an unrealistic original estimate.

Why it matters: labour is usually the largest cleaning cost. Small repeated variances can remove margin without creating an obvious operational crisis. Review exceptions weekly and the full trend monthly. Never reduce hours solely to improve this KPI without checking quality and contractual requirements.

5

Labour cost percentage

Labour cost percentage is total direct labour cost divided by contract revenue. If wages, employer costs and paid leave allocation total £8,100 against £12,000 monthly revenue, labour cost is 67.5%. Define what is included and use the same basis every month.

Why it matters: hours can be on budget while labour cost rises because of overtime, pay-rate changes or expensive cover. This KPI connects workforce decisions to commercial performance. Compare actual percentage with the quotation model and investigate material movement rather than treating one universal percentage as correct for every contract.

6

Cleaning audit score

Audit score gives a structured measure of service quality across tasks, areas or zones. Review average score, but also show the lowest-scoring sites and repeated failures. A company average of 94% can still hide a washroom task failing repeatedly at one large customer.

Why it matters: audits provide evidence before issues become complaints. They also support coaching and customer reviews. Keep scoring rules consistent and use notes or photographs where evidence is useful. Compare like with like: a detailed task audit and a short supervisory inspection should not be treated as identical.

7

Audit completion rate

Calculate completed audits divided by scheduled audits. If 45 of 50 planned audits were submitted on time, completion is 90%. Late audits should be visible rather than counted as if the quality plan was followed correctly.

Why it matters: an excellent scoring system has little value when inspections are missed. Low completion may point to supervisor capacity, poor scheduling or unclear responsibility. Review weekly for overdue work and monthly for trends. Use the result alongside audit scores, because perfect completion of weak inspections is not meaningful assurance.

8

Corrective action closure rate

Measure actions closed by their due date divided by actions due. If 32 actions were due and 28 closed on time, the rate is 87.5%. Also show overdue high-priority actions and average days to closure.

Why it matters: recording a failure is not the same as resolving it. This KPI shows whether quality management closes the loop. Repeated extensions, missing evidence or the same issue returning after closure are warning signs. A lower number with honest evidence is more useful than closing actions administratively to protect the score.

9

Complaint rate and resolution time

Count complaints in context, for example per 100 completed visits or per £100,000 of contract revenue, then measure the time from report to agreed resolution. If 8 complaints occur across 2,000 visits, the rate is 0.4 per 100 visits.

Why it matters: complaint volume shows customer friction, while resolution time shows responsiveness. Low complaints do not always mean high satisfaction; customers may stop reporting before leaving. Review complaint themes, recurrence and sentiment alongside audit and customer-review information.

10

Rework and supervisor rescue hours

Record paid time spent correcting missed or failed work outside the planned specification. Include supervisor time when they repeatedly clean rather than manage. If a site uses 18 rework hours against 400 planned hours, rework equals 4.5% of planned delivery.

Why it matters: rework is a hidden cost of poor quality, weak training, absence or unrealistic task allocation. It can protect the customer relationship short term while damaging margin and supervisor capacity. Tracking it makes the true cost visible and helps identify where a root-cause review is needed.

11

Staff absence and retention

Absence rate can be calculated as absent scheduled hours divided by total scheduled hours. Staff retention is the percentage of employees who remain over a defined period. Separate voluntary leavers, dismissals and TUPE-related movement so the number can be interpreted correctly.

Why it matters: unstable teams increase recruitment, induction, cover and management costs. Trends often reveal difficult sites, unsuitable work patterns or weak onboarding. These are management signals, not reasons to penalise legitimate sickness. Use them with return-to-work processes, employee feedback and contract context.

12

Contract retention and customer health

Contract retention is renewed or retained contracts divided by contracts eligible for renewal, preferably measured by both count and annual value. A business retaining 18 of 20 contracts has 90% retention by count, but losing its largest account could make value retention much lower.

Why it matters: retention protects recurring revenue and reduces the pressure on sales. Add a customer-health view combining open complaints, audit trend, overdue actions, meeting sentiment and renewal date. This creates an earlier signal than waiting for a cancellation notice.

13

Contract gross margin

Gross margin is contract revenue minus direct contract costs, divided by revenue. If monthly revenue is £15,000 and direct labour, materials and allocated service costs are £12,300, gross margin is £2,700 or 18%.

Why it matters: growth without margin can weaken cash flow and management capacity. Review margin by contract, customer, branch and service type. Investigate differences between quoted and actual performance. Margin should never be viewed alone: reducing required hours or materials may improve the figure temporarily while damaging quality and retention.

Putting measures together

A worked cleaning KPI example

Consider a regional contractor reviewing one office-cleaning contract. Attendance completion is 99%, the audit score is 93% and there were no formal complaints. At first glance the contract looks healthy. However, delivered hours are 6% above budget, rework is 4% and the supervisor records regular rescue visits.

The combined measures change the decision. The problem is not basic attendance; it may be task allocation, training or an underestimated specification. Management can examine failed audit areas, compare planned task times with actual delivery, retrain the team or discuss scope with the customer. One KPI would have hidden the issue. A balanced dashboard makes it actionable.

Targets and thresholds

How to choose targets

Targets should start with the contract, current baseline and business model. Avoid copying an industry number without checking whether the definition matches yours. A 98% attendance target is meaningless if one company counts any check-in as attendance while another requires the full scheduled shift.

Use three levels where helpful: target, warning and critical. For example, audit completion might be green at 95% or above, warning at 90-94.9%, and critical below 90%. Set the response as well as the colour. A critical result should identify who investigates, by when and what evidence is needed.

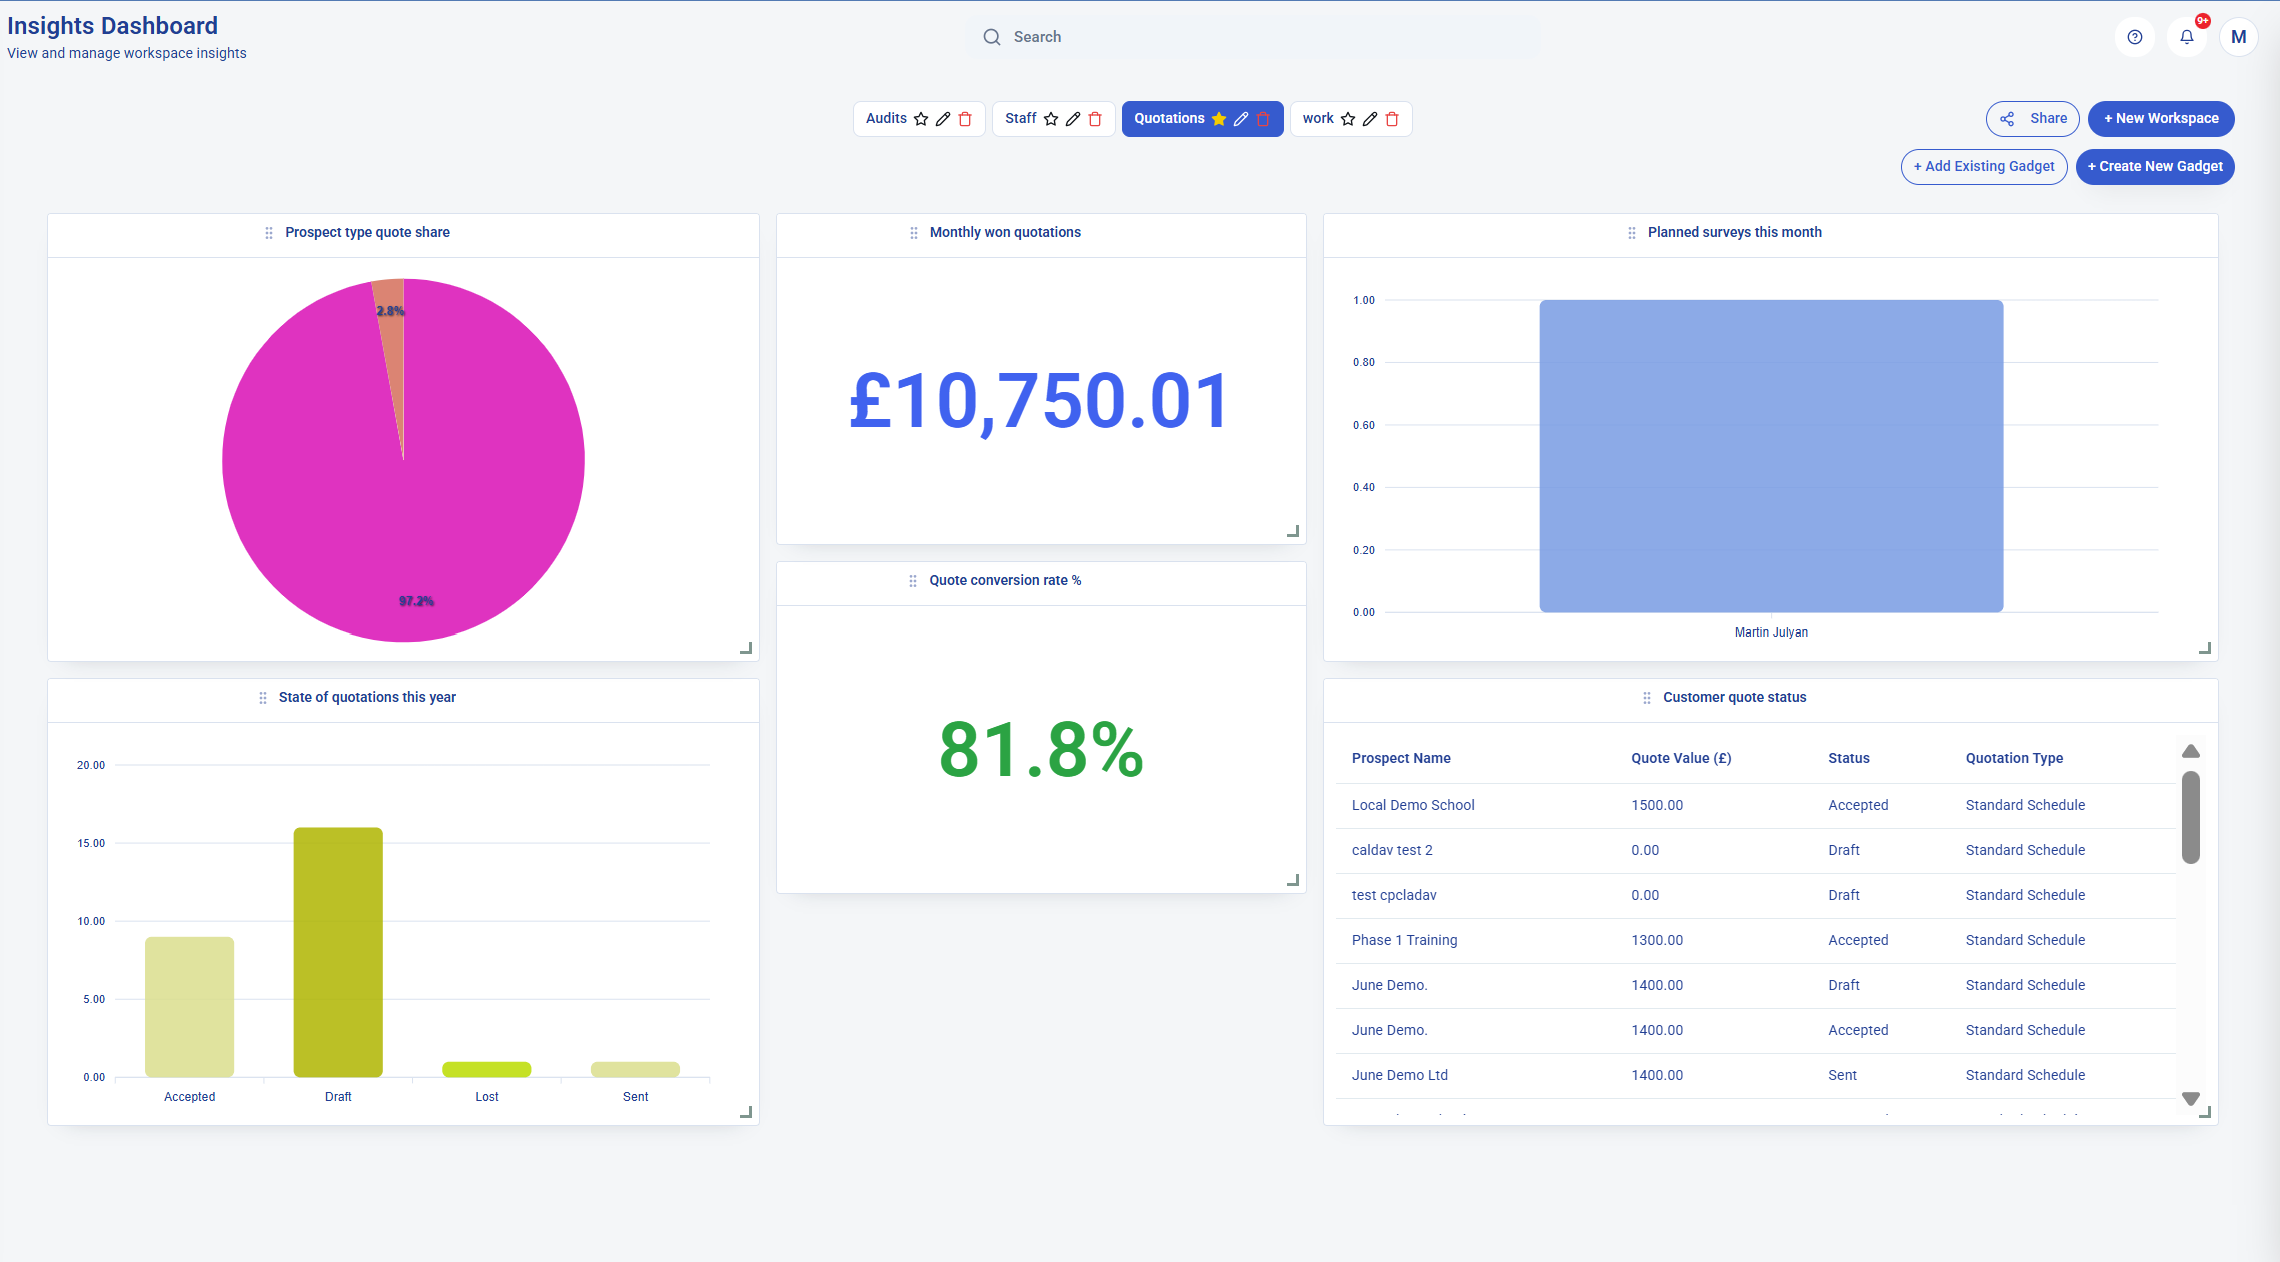
KleanFlo dashboard for quotation, audit, customer and workforce KPIs A focused KPI dashboard should support decisions rather than display every available number.

From data to decisions

Building a cleaning business KPI dashboard

Start with the decisions each audience owns. A supervisor may need today’s missed shifts, overdue audits and open actions. An account manager may need customer health, complaints and labour variance. Directors may need sales conversion, retention, revenue and margin. Separate workspaces are usually clearer than one crowded company dashboard.

Each KPI should have a definition, data source, owner, review rhythm and action threshold. Keep the underlying operational records accurate. A dashboard cannot fix inconsistent check-ins, unrecorded rework or complaints held in personal inboxes.

KleanFlo Insights lets cleaning companies create workspaces and add gadgets for the measures relevant to sales, audits, staff, customers and operations. Because the dashboard sits alongside day-to-day KleanFlo records, managers can move from a headline measure to the operational context behind it.

Avoid misleading reports

Common KPI mistakes

A useful dashboard should focus attention on decisions. Too many measures, inconsistent definitions and averages without context can make reporting look complete while important exceptions remain hidden.

Agree what each KPI means, who owns it and what action follows a warning or critical result.

1
Tracking too much

A long report can hide the few exceptions that need action.

2
Using averages alone

Company averages can conceal a failing site or contract.

3
Changing definitions

Inconsistent calculations make month-to-month comparisons unreliable.

4
Rewarding the number instead of the outcome

Teams may close actions too early or avoid logging complaints.

5
Reviewing too late

Monthly reporting is not enough for missed shifts or urgent service risk.

6
Ignoring context

A KPI should prompt investigation, not replace management judgement.

FAQs

Cleaning business KPI questions

What are the most important KPIs for a commercial cleaning company?

Start with quotation conversion, attendance completion, labour hours against budget, audit score, corrective action closure, complaint rate, rework, contract retention and gross margin. Add focused measures where they support a specific decision.

How many cleaning KPIs should a business track?

A management dashboard normally works best with eight to twelve decision-making KPIs. Give operational teams their own focused views rather than placing every available metric on one screen.

How often should cleaning KPIs be reviewed?

Review attendance and service exceptions daily, quality and labour exceptions weekly, and sales, retention and contract profitability monthly. The correct rhythm depends on how quickly a result can change and how urgently action is needed.

What is the difference between a KPI and a target?

The KPI is the measurement, such as audit completion rate. The target is the expected level, such as at least 95%. Warning and critical thresholds can define when management action is required.

Can KleanFlo create cleaning KPI dashboards?

Yes. KleanFlo Insights lets managers create focused workspaces and add dashboard gadgets for areas such as quotations, audits, staff, customers and operations.

Want cleaning KPIs built from live operational data?

See how KleanFlo Insights brings quotations, audits, workforce, customer and operational measures into focused dashboards.

Explore KleanFlo Insights